

Pollution Through China’s Own Lens, is a web-based application that documents how Chinese citizens respond to the country’s pollution by gathering images they post on China’s Twitter (Weibo). The pictures of Chinese landscapes shrouded in haze, show what it looks like on the ground in many of China’s most polluted cities, and reveal that the problems are widespread. Visitors to the application view social media postings in categories generated from Weibo hashtags about pollution. The map interface allows users to observe spatial trends in the pollution posts.
Social media is widely used in China, including to discuss important social issues. Environmental pollution - most notably air pollution caused by China’s vast factories - is one of the most controversial topics. Yet the government’s tight control of information makes it hard to know how Chinese citizens react to these conditions. Discussions on social media are not always captured by these government controls and can provide a lens into Chinese public opinion.

Weibo post featuring an Algal Bloom in the South China Sea.
EXPLORING THE APPLICATION

Mapping Application with Dynamic Gallery
When users first navigate to the application, a window will lead them to a map that displays camera postings clustered by location across China. Users can click on a groups of posts to zoom in to specific locations. Individual posts are represented by a camera. At the bottom of the map, a single row of images represents posts within the current extent of the map. Hovering over a single camera icon will locate the post in the row of images. Users can click on an image to see it at a higher resolution and go to the gallery. In the upper left of the map, Filter by Category can be used to see different types of posts.
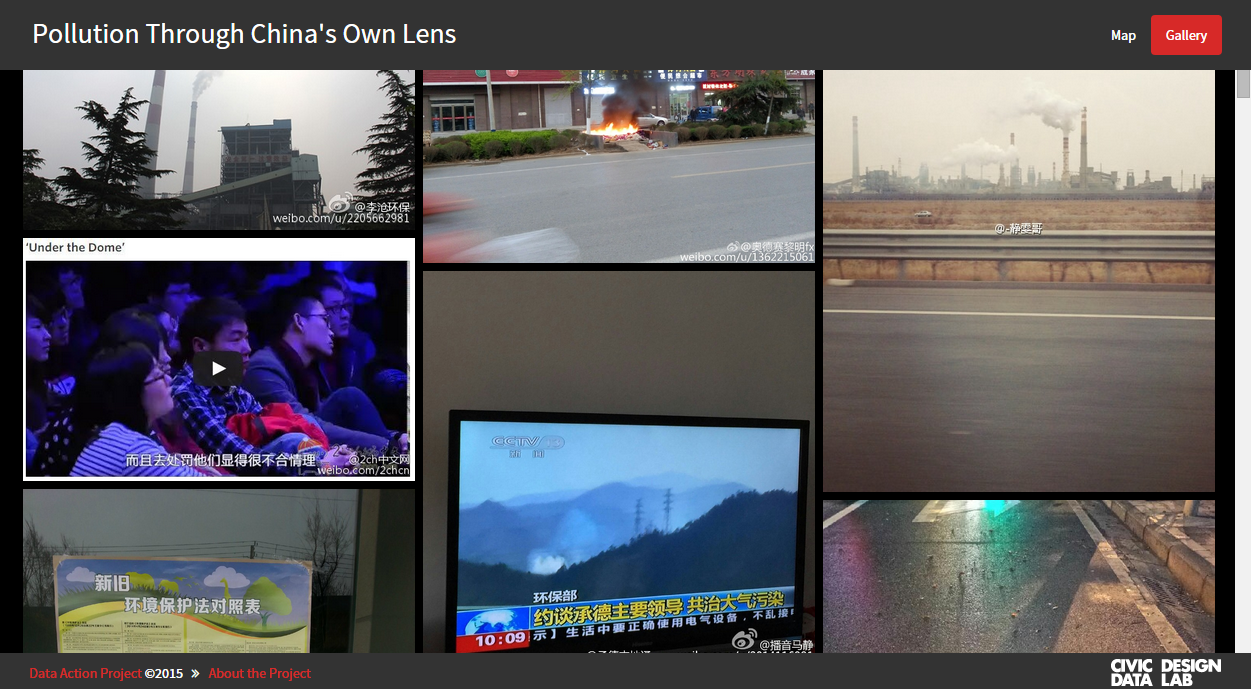
Gallery Application with Rich Display of Posts
The gallery component operates in a similar fashion to the mapping application. To visit the gallery, click on an image in the map, then click View Gallery. Users can also click the Gallery button at the upper right of the map. The gallery allows for filtering by category. Click on each image to read more on the post and get a detailed view of the post. In this detailed view, if you click View on Map, the application will take you to the location of the post in the map component.

Detailed View of a Weibo Post on Pollution in Shanghai
THE DATA-GATHERING PROCESS
On a recent trip to China, our research team saw first-hand the prevalence of social media use, including online shopping, pay for services (such as a class or tickets to a museum), event registration, voice chat, among many other applications. Social media apps such as Wechat, QQ, and Weibo (the Chinese version of Twitter) are ubiquitous and essential to life in China. Even Apple CEO Tim Cook has joined Weibo, a move that not only reveals the importance of China to the western economy, but also the centrality of social media in China. Despite its prevalence, or perhaps because of it, the Chinese government strictly controls what is posted on social media.
The research team decided to use Weibo, a Twitter-like microblogging platform, to gather images of pollution that people captured and posted to the app. This was partially out of convenience (they have an API) and partially due to the fact that we know Weibo monitors and censors certain topics such as pollution, making us curious about what we'd find. Unfortunately, Weibo recently disabled their API functionality that would allow searching based on hashtags, such as pollution. The team therefore decided to scrape the Weibo website instead, looking for images with specific hashtags. For those of you unfamiliar with web-scraping, it is a technique of gathering data straight from the html code that creates a website.

Data embedded in the html of a website
The hashtags we chose are based on issues we know to be pressing in China. For instance "Yellow Dust" refers to the seasonal dust storms in East Asia that bring sand from the deserts of Mongolia. It has become a bigger issue in the past few years due to the pollutants contained in the dust. Another category, "PM2.5", stands for Particulate Matter 2.5, an air pollutant that can come from automotive exhaust as well as other operations that require burning of fuel. In Beijing, a city known for its high levels of air pollution, the city measures the concentration of PM 2.5 daily as an indicator of the air quality outside. Some of the categories that we scraped, such as "Pollution" and "Air Pollution" didn't yield great results - the Weibo site had only a handful of images for each month. Other categories such as "Haze" or "Take Pollution Pics", got us dozens of images DAILY. When we asked our Chinese friends about this, they said that sometimes Chinese censors don't catch certain phrases and therefore do not remove them from Weibo. Furthermore, sometimes people explicitly use slang to communicate about sensitive issues. This article from The Wire explains a little more about how slang is used to escape censorship.
After we scraped the Weibo website, we kept only the data attached to a user ID in order to connect the image to information about the user himself through the Weibo API. This gave us information such as the user's sex, age, city, followers, etc. We used the "city" category to map the photos. As such, the photos are a representation of where the users are from, and not necessarily where they were taken. Nevertheless, through this process, we were able to create a dataset that reflected a collection of images of how (or sometimes not!) Chinese people understand pollution through pictures. Many images are face mask selfies, others are city-scapes, but you can barely see the buildings because of the pollution cover. Relative to other countries, and due to censorship, Chinese social media does not tell us too much, but even the small amount of information that it is available can tell a powerful story.
CLICK HERE TO VIEW THE APPLICATION
Click to view the application and explore the impact of pollution on the ground in China and in everyday life for Chinese citizens using social media as our lens.
Special thank you to Alan Jones for assisting on a large part of data-scraping process and helping us navigate the giant firehose that is Weibo's stream of posts!
-Mike Foster, Wenfei Xu, and Sarah Williams