
By Erica Deahl
Over the past few weeks, we’ve been implementing the second pilot test of City Digits: Local Lotto, a curriculum we’re developing with Brooklyn College and the Center for Urban Pedagogy to teach mathematics in low-income high schools through an investigation of the social impact of the lottery. We have been developing a web-based platform for the curriculum that enables students to collect qualitative interview data about the lottery’s presence in their neighborhood, analyze quantitative data about citywide lottery spending, and publish their opinions.
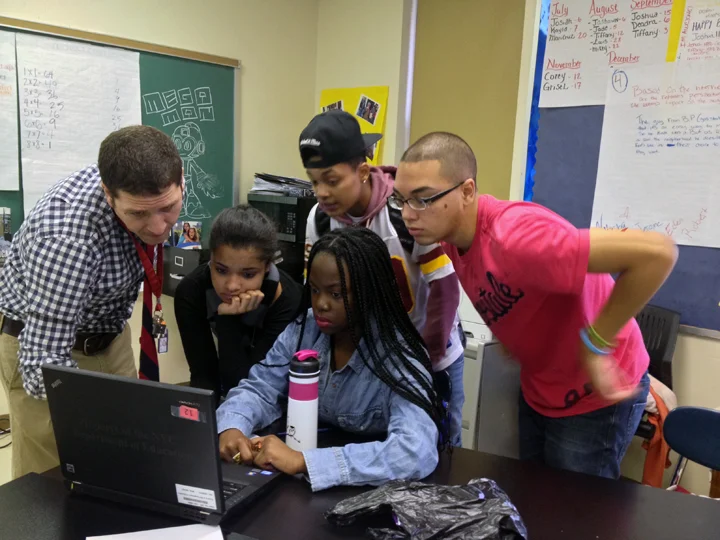
I had the opportunity to observe and participate in several of the sessions, conducted with a class of high school seniors in Brooklyn. It was exciting finally getting the tool into teens’ hands and helping them really dig into some tough questions — and mathematics — around the lottery. Following are photos and highlights from the sessions. You can check out some of the students’ work at http://citydigits.mit.edu/
Field Investigations
On the interview day, the class broke into four teams and set out on different routes around the neighborhood to interview their neighbors about the lottery.
I tagged along with the green team. At first, the students were shy about approaching people, but they became energized when they discovered people were eager to talk to them and had strong opinions about the lottery. The green team even interviewed one of their teachers: “Do you think I want to teach until I die? Every week I hope to win the lotto… If I won, first of all, I would buy my best class computers, every one of you. I would truly do that.”

City Data
Over the course of two days, students used the interactive maps we created to learn about citywide implications of the lottery. They looked at median household income in different neighborhoods across the city and compared those statistics to the amount of money spent on lottery tickets, calculating the percentage income spent on lottery tickets in different areas. Students also explored lottery winning versus spending.
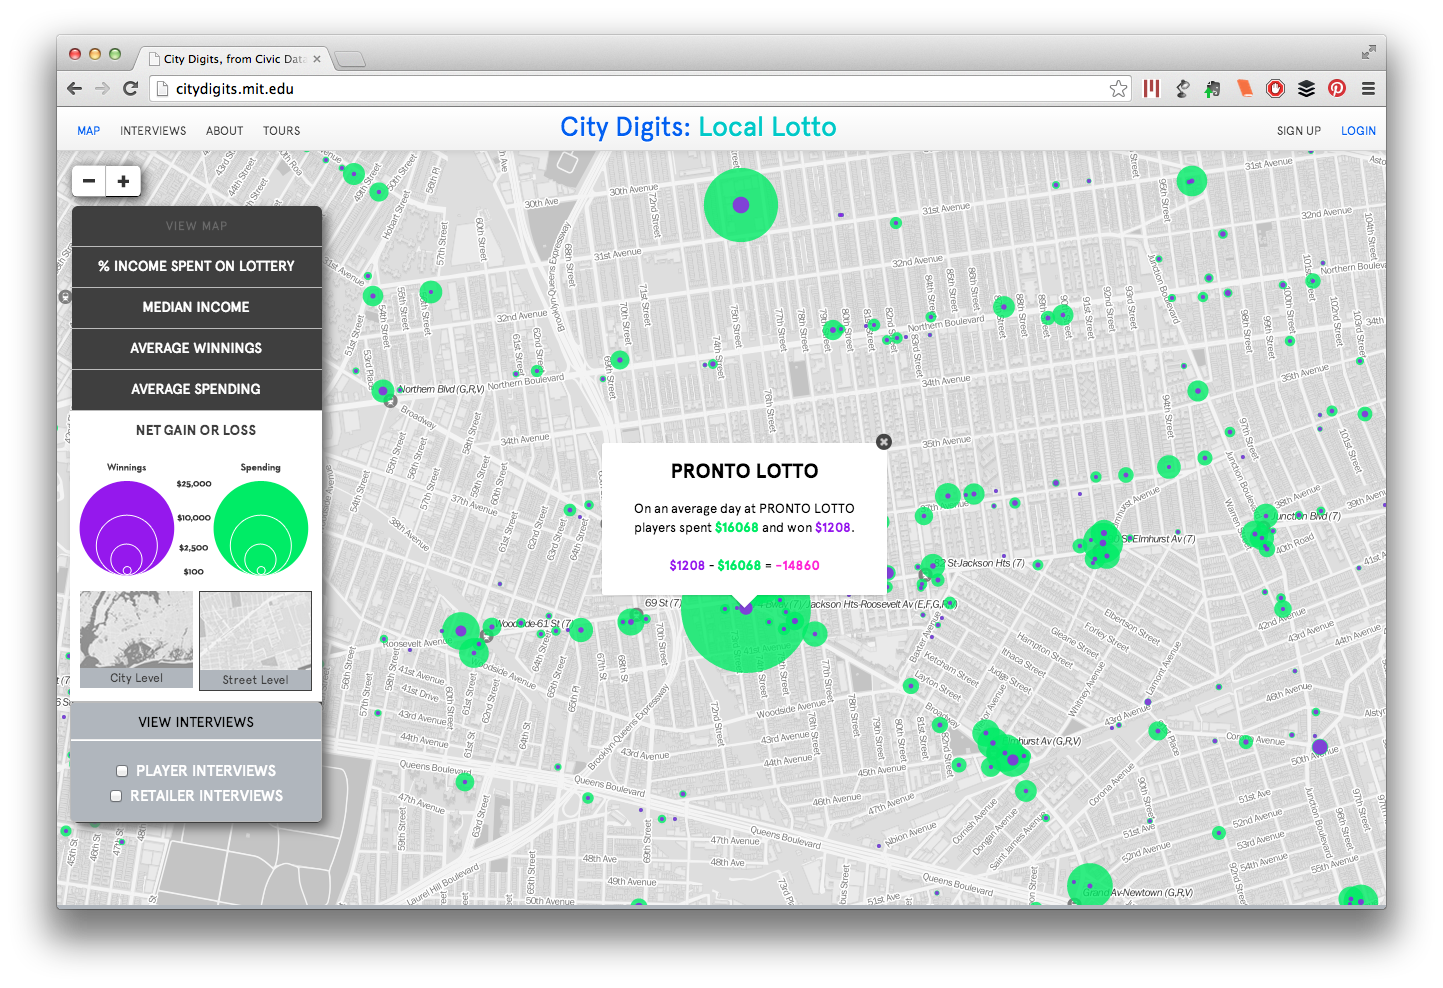
The green circles represent the amount of money spent on lottery tickets at individual retail stores. The purple circles represent the amount of money won from lottery tickets at the same stores.
Local Lotto Tours
In the final sessions, students worked in groups to develop storyboard “tours” presenting their opinions on the lottery, using multimedia evidence from the other class sessions.
The group I worked with argued that the lottery was good for the city, since 38% of proceeds go to education. They disagreed with many of their classmates’ opinion that the lottery is a tax on the poor, arguing that no one is forced to play.
What did we learn?
Implementing a classroom curriculum, especially facilitating the use of a custom digital technology, was more complex than we could have imagined. Some students were frustrated by aspects of the technology, giving us feedback that we will use to improve the next version of the tool. It was also a challenge at certain points to hold the attention of the group, support different levels of understanding, and allow for sufficient discovery within the restraints of 60-minute sessions.
Despite the challenges, we were thrilled that the students gave us incredibly positive feedback when the program concluded. Students appreciated that the technology enabled them to explore concepts individually and in groups, rather than listening to a teacher lecture, and many agreed that the course succeeded in engaging students who didn’t normally participate in class.
“[In typical math classes] the teacher gives you a paper and explains it, then you probably finish the paper before he’s done talking, and you sit and talk for the rest of class. It's boring.” Local Lotto, though, was different. "You can ask the class. I’ve never seen a class even work like this ever before… Everyone was so interested. I didn’t think that was possible.”
One student said he has been showing his mother his work and that he convinced her to stop buying lottery tickets. He explained that he has been working really hard in the class, which he doesn’t usually do, and that it has been positively affecting his performance in other classes.
The students were a pleasure to work with, and we were excited that they took an active interest in this complex and sensitive topic and really took on the challenge of making the investigation their own. We certainly encountered challenges along the way and plan to continue developing the program based on the feedback we received. But we came out of the experience convinced that culturally-relevant mathematics pedagogy, supported by interactive learning technologies, succeeds in engaging students who aren’t normally interested in math. And, given the right support and resources, these students have the ability and desire to conduct sophisticated investigations of the social and political issues affecting their communities.
We’re excited to start on the next step, developing a second module around another urban social justice theme.